Florida Impacts
For the last several days, I have been suggesting Matthew in 2016 would be one of the better analog events to help understand Dorian’s potential impacts. Now 90 miles east northeast of Dayton Beach, Florida with winds of 105 mph, Dorian is on par with the strength of Matthew, although Matthew was much closer to the coastline at 35 miles.
This morning the power outage map indicates only 15,000 customers are without power across Florida. Power outages are a good reference to potential damage - during Matthew, for example, power outages across Florida reached over 1,000,000 customers. The power outages are a function of high wind speeds and, thus far, they have only been of tropical storm force along the coastline. The highest wind speed I observed this morning was 60 mph at Cape Canaveral. During Matthew, several hurricane-force wind gusts were reported, including a 100 mph gust at the same location. It appears that the overall Florida insurance loss from Dorian will likely be less than Matthew, 2016 which was around $1B across the state.
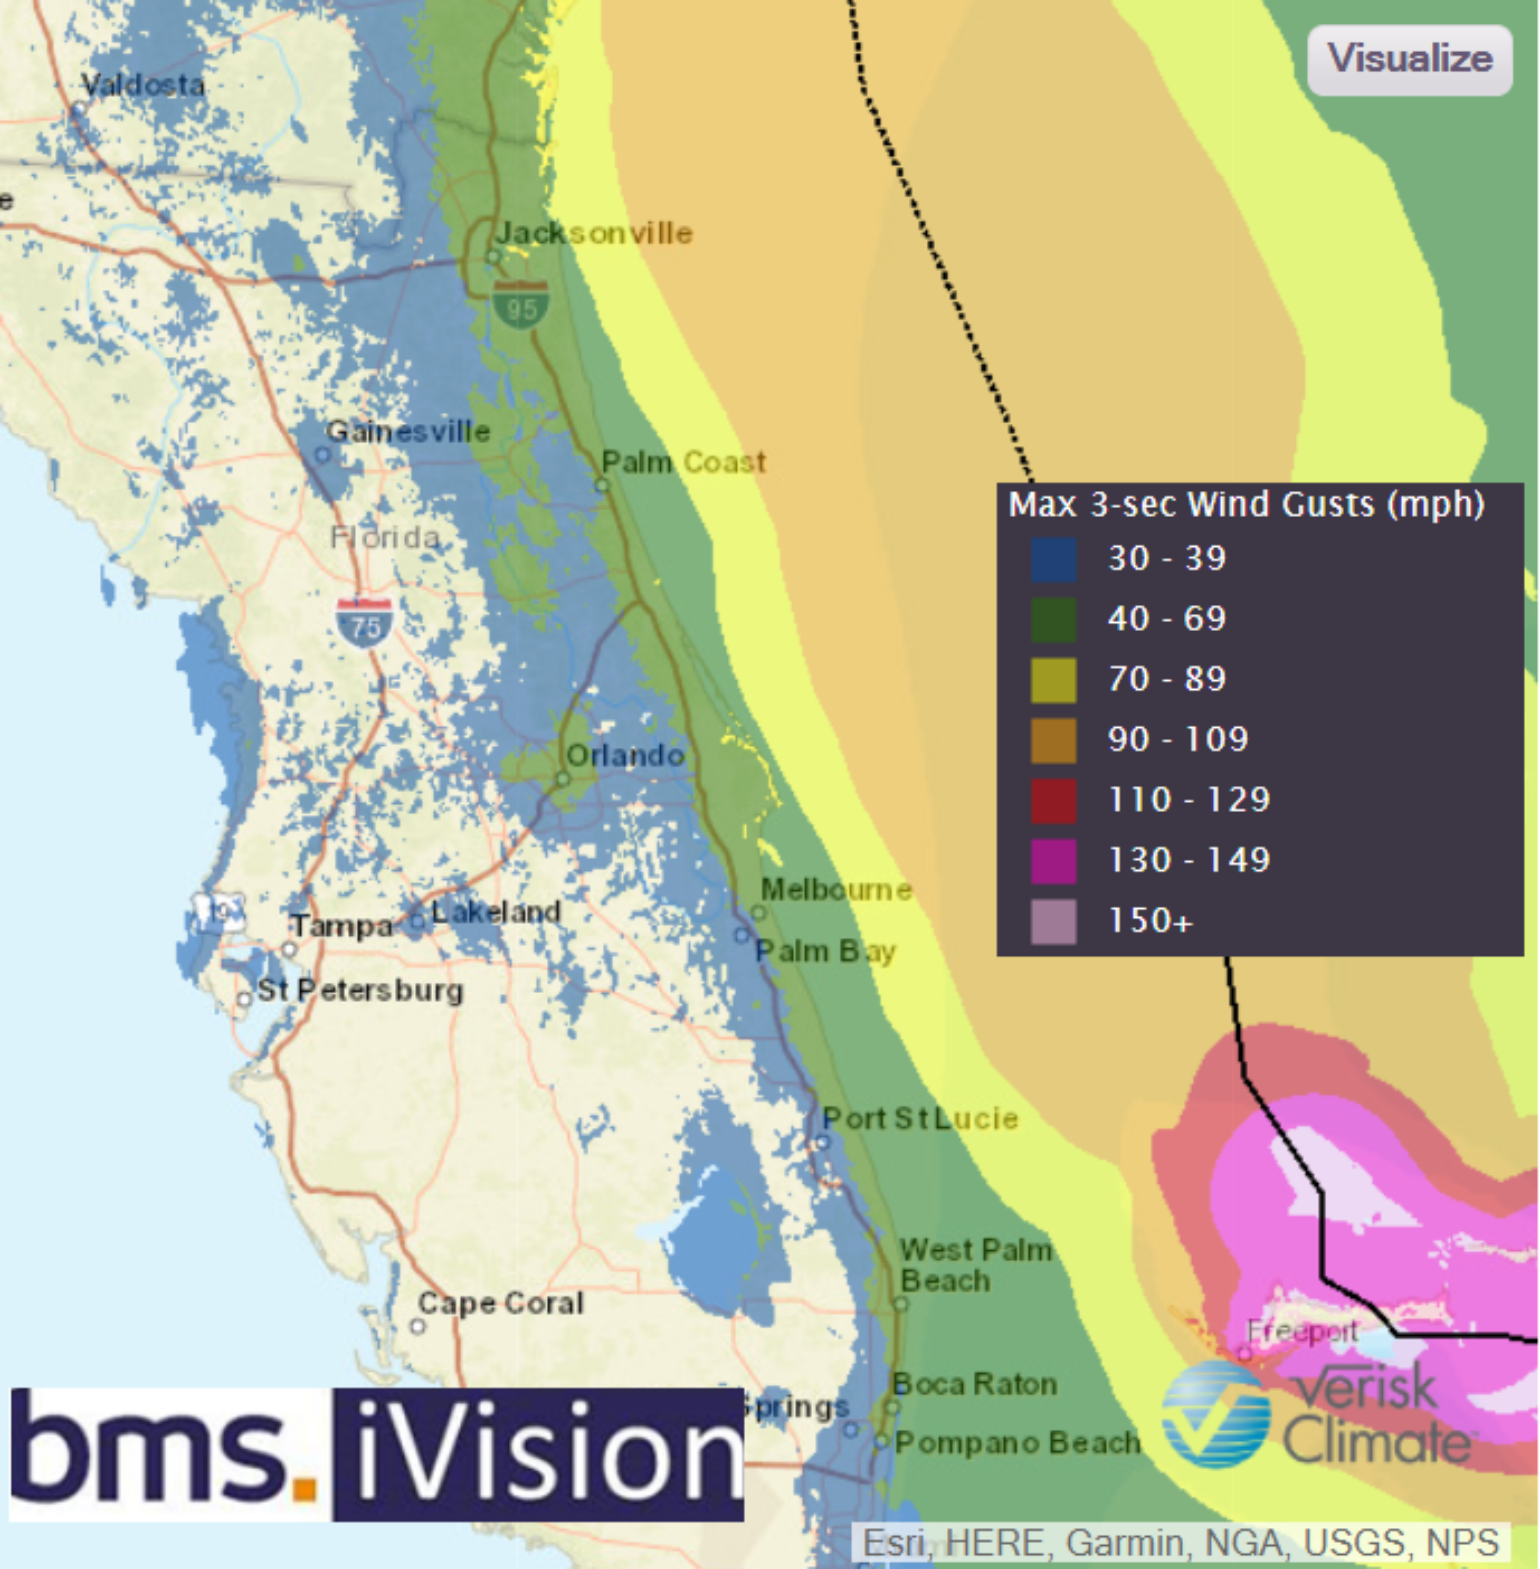
There are signs that Dorianis tapping into the warm waters of the Gulf Stream and may regain some of the intensity that it lost to the upwelling in recent days. The expansion of the storm’s wind field is notably impacting Florida in terms of high waves and a storm surge of 1 - 2 feet. Since Dorian is a large storm, it takes exponentially more energy to ramp up wind speeds in the storm’s current eye wall than when it was much smaller. At this time,I don’t expect Dorian to get much stronger as it tracks along the coastline over the next 48 hours.
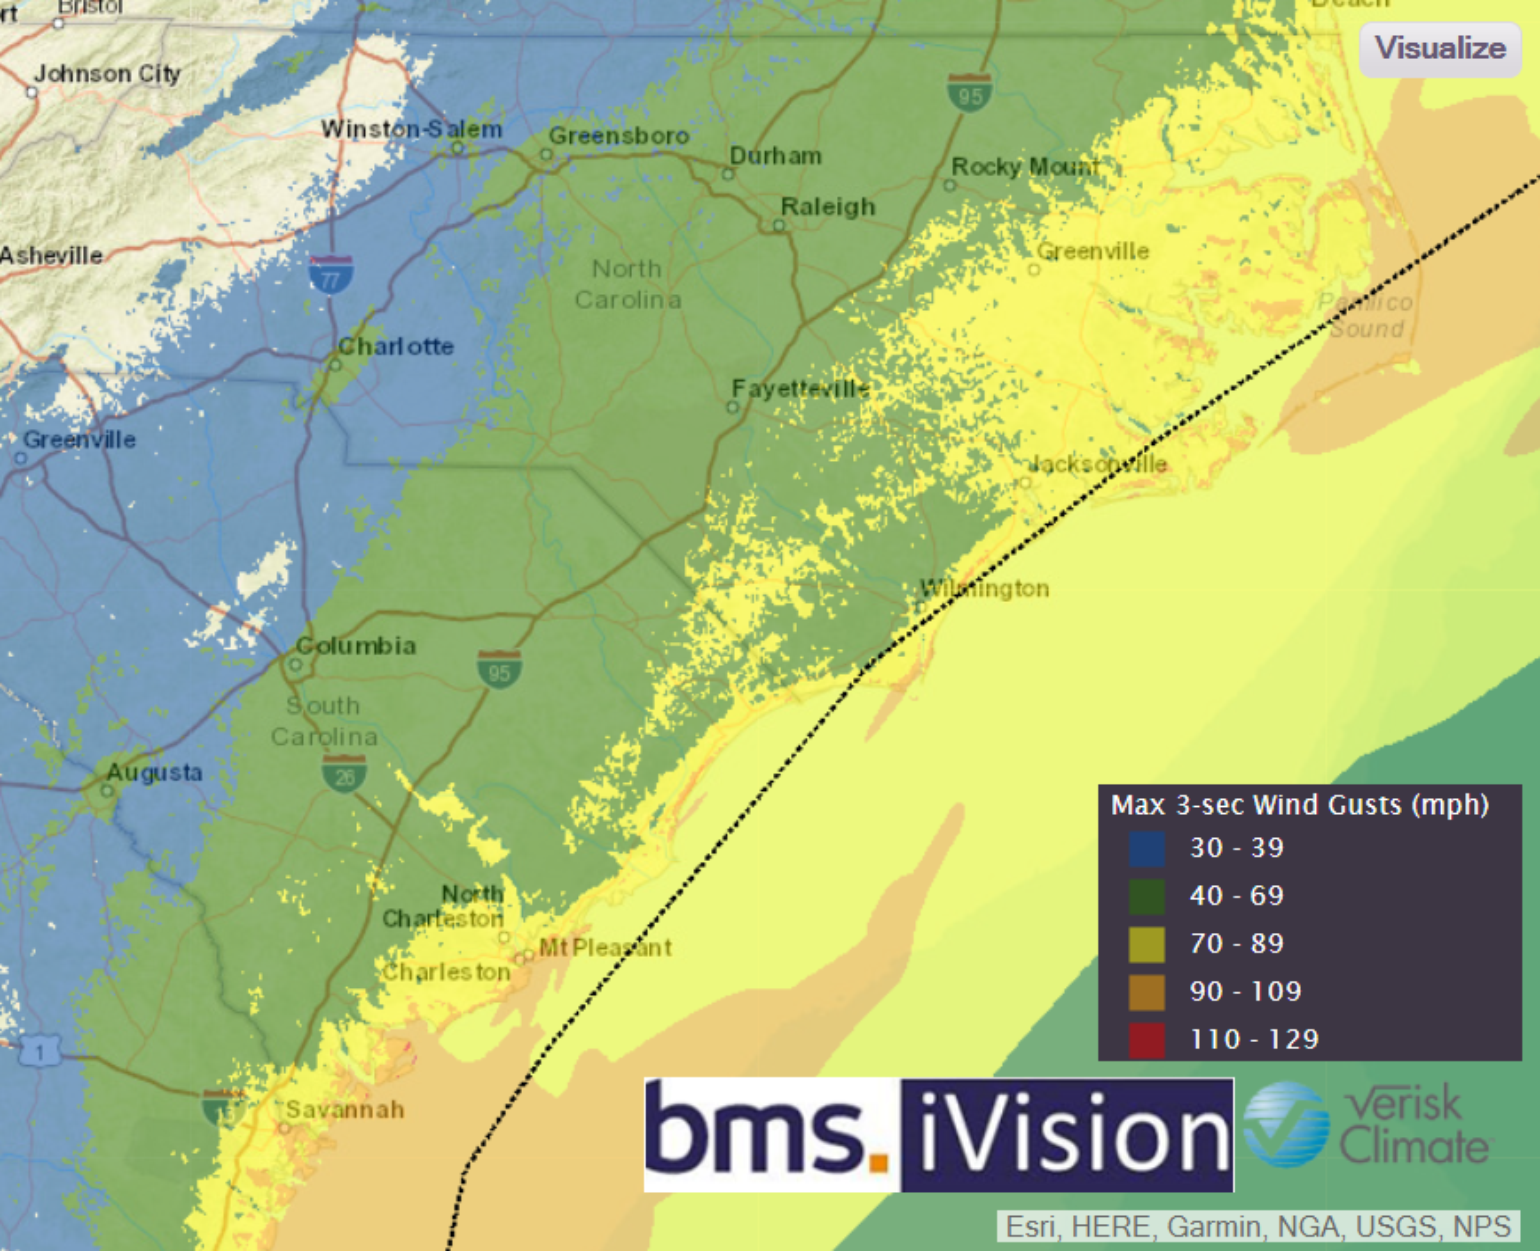
Carolina Impacts
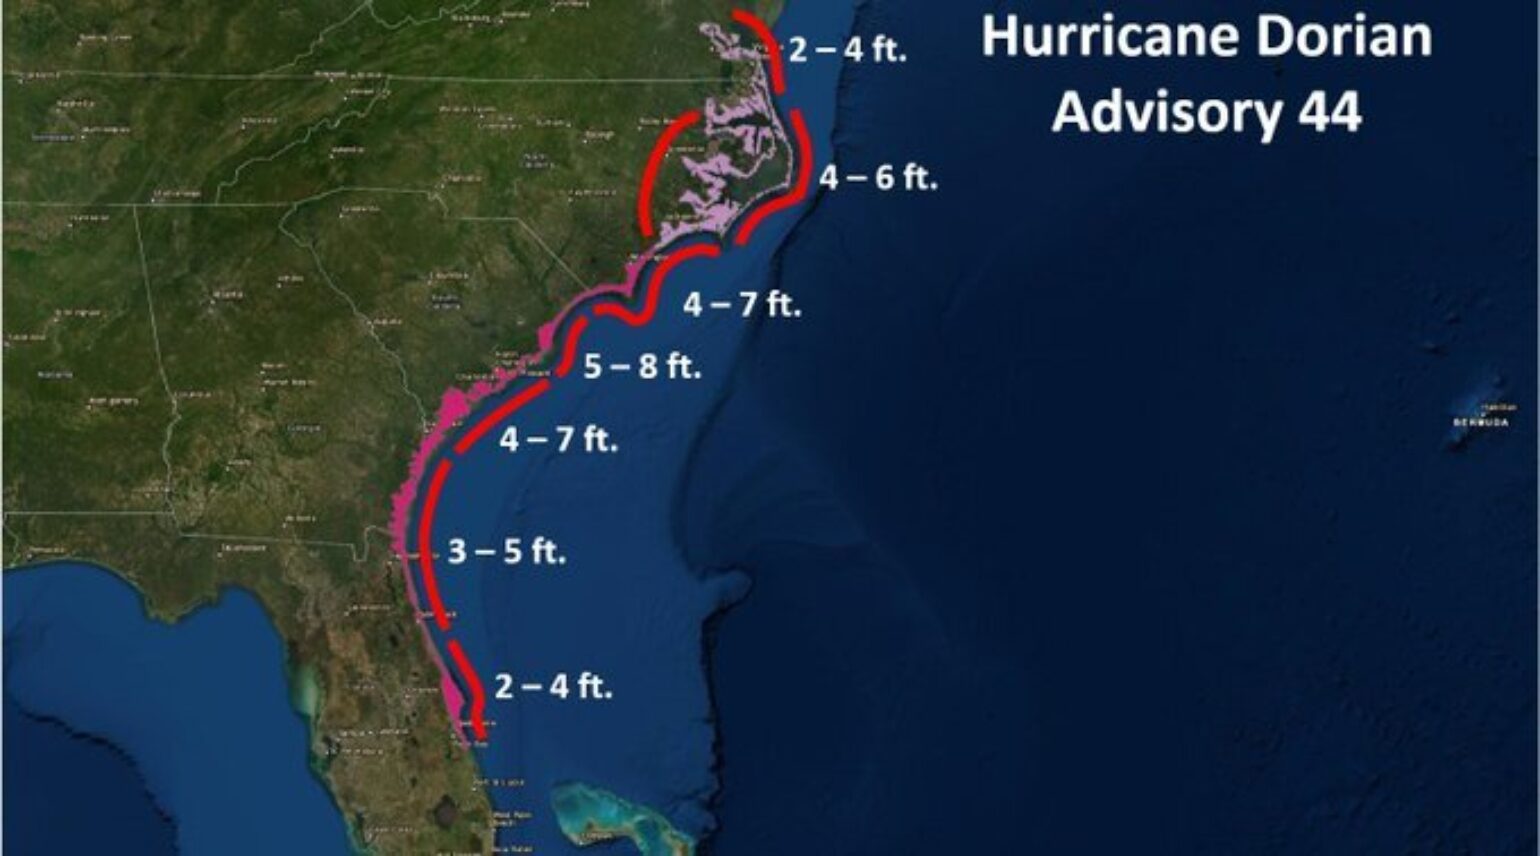
Overnight the model guidance has continued to suggest that Dorian will track very close to the coastline of South and North Carolina, with the newest ECMWF forecast indicating that the center of Dorian will track over Bald Head Island and Cape Lookout, NC as a Category 1 hurricane. The NHC currently does not have Dorian making a U.S. landfall, but a landfall on Cape Romain, SC, Bald Head Island, NC or, especially, Cape Lookout, NC can’t be ruled out. There is a 100% chance that hurricane conditions will be experienced along the coast given how close Dorian will track to the coastline. The worst impact may be on the southern Outer Banks of North Carolina.
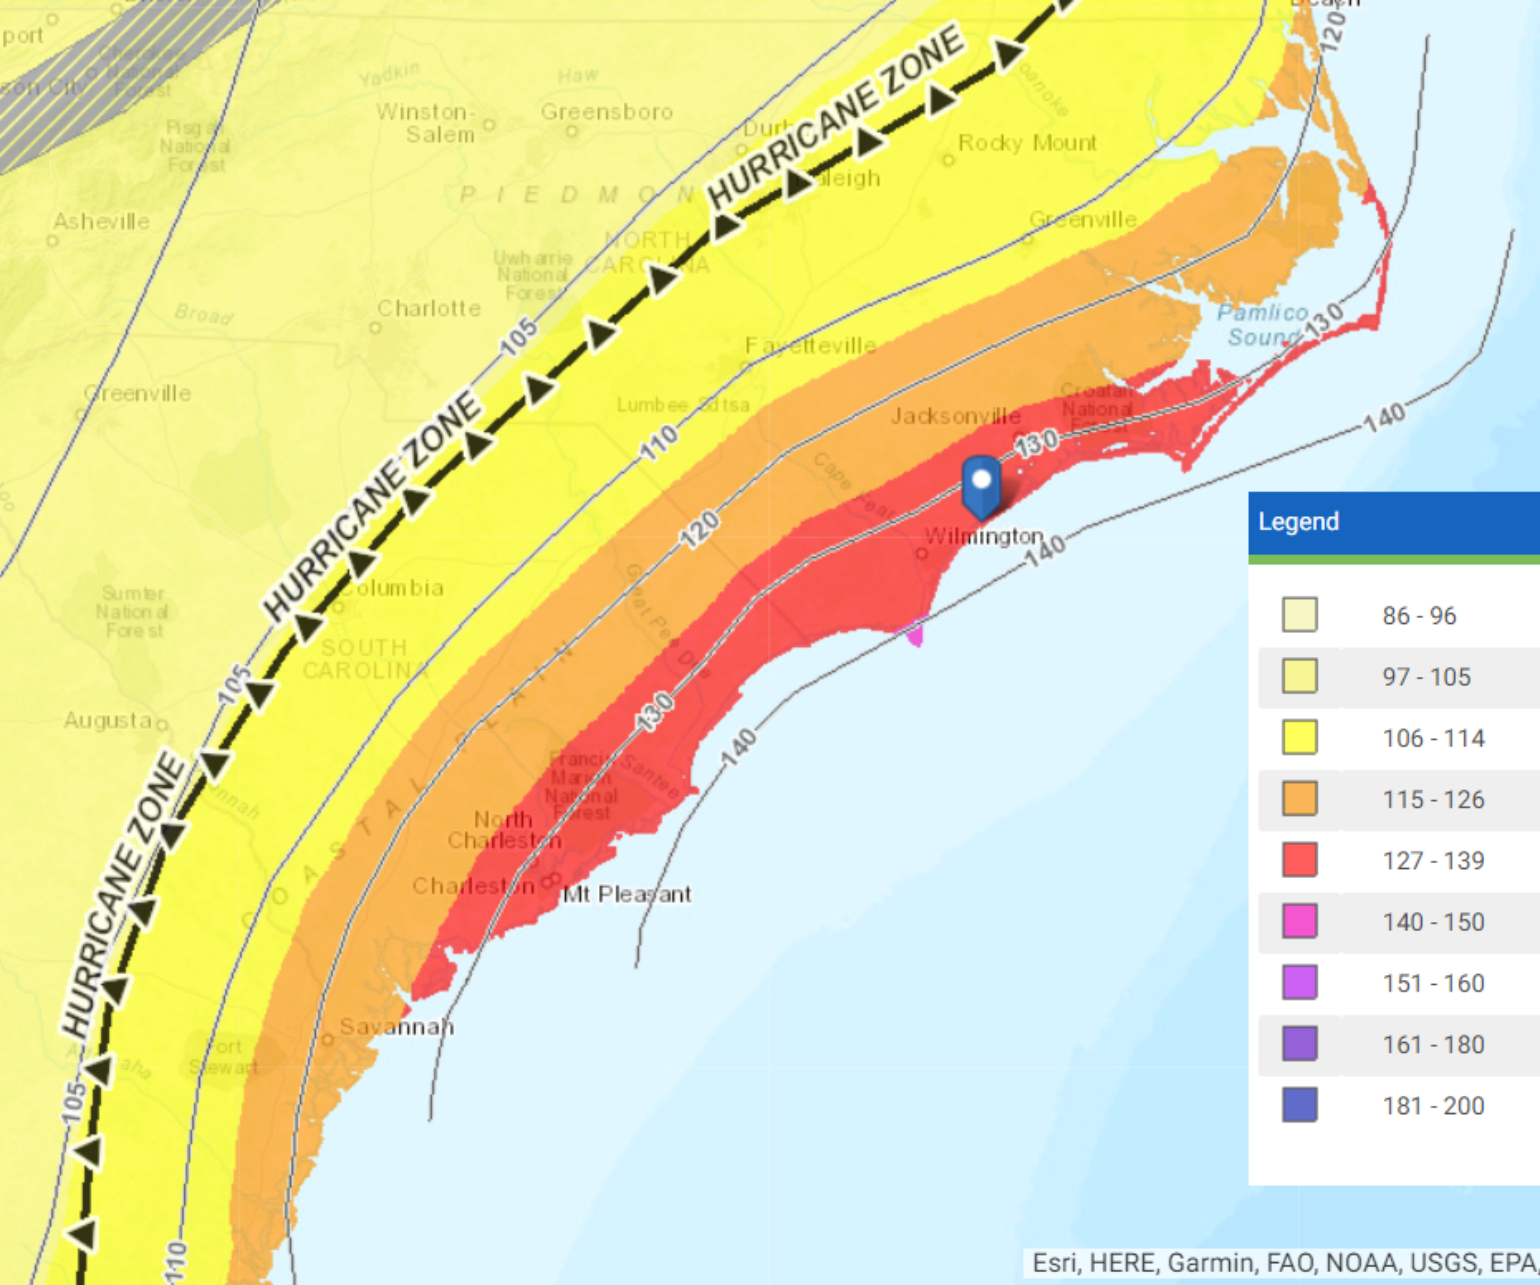
When analyzing wind impact, it’s important to understand the design of typical structures across the Carolinas. The following is a great online interactive map. It should be noted that older structures would have slightly different wind speed thresholds depending on the era, but generally, the trend would be similar to what is shown below. An assessment by the Insurance Institute for Business & Home Safety (IBHS) suggests that the residential building codes and enforcement level are not as highly ranked as Florida. However, South Carolina is closer to Florida, while North Carolina was still behind on adapting the latest national building codes as of 2018.
Given how close Dorian is expected to track to the coastline, it will likely result in the coastal plain experiencing 5 to 10 inches of tropical storm force wind-driven rain. The rainfall amounts will taper inland, but much of the eastern portion of central North and South Carolina could experience 1 to 4 inches of rain.
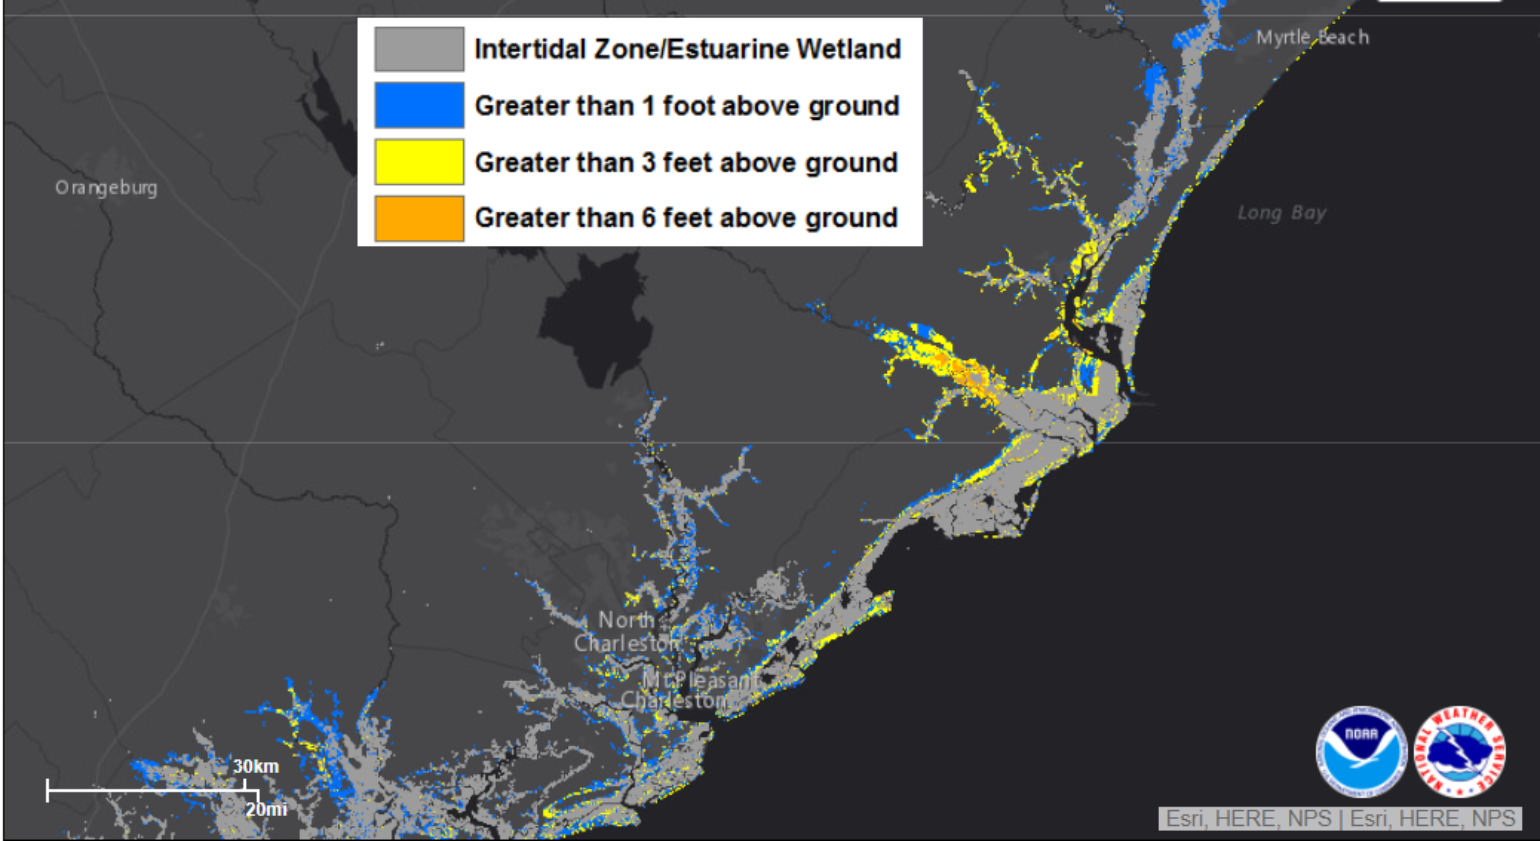
The center of #Dorian may still be off the FL coast, but impactful coastal #flooding at high tides today/tonight in GA/SC.
— Jonathan Erdman (@wxjerdman) September 4, 2019
-Ft. Pulaski, GA (~1p today) exceeded only by Matthew & Irma.
-Charleston, SC (overnight tonight) may top Matthew & Irma, exceeded only by Hugo. pic.twitter.com/wejOfi6jIO
Analog Events for the Carolinas
I mentioned yesterday that there are many variables to consider when evaluating the potential outcomes of Dorian and one, in particular, may stand out. When Category 2 Hurricane Arthur tracked over the Outer Banks of North Carolina in 2014, it became the only Category 2 hurricane to make U.S. landfall and not result in an insured loss, according to Property Claim Services. So, there is a chance that the resiliency of structures and the nature of Dorian’s structure as it passes along the coast of the Carolinas may also result in minimal loss. In addition to Arthur, hurricanes Ophelia in 2005, Irene in 1999, Gladys in 1968 and Donna in 1960 are all good analog events that could be used to help understand the impacts from Dorian over the next 48 hours. The range of insurance industry loss from these events ranges from $250M to $2B for the Carolinas.
There are encouraging signs that theoverall insured impacts from Dorian will be minimal across Florida, but thereis still uncertainty around the potential impact to points north in theCarolinas, which will likely experience areas of insured loss.