Catastrophic weather events in 2017 left the re/insurance business with a conundrum. Record-breaking insured catastrophe losses exceeded any previous year. However, the impact of those unprecedented losses on re/insurance pricing has been less than many had hoped for or expected. Claims of nearly $140 billion have not delivered a traditional hard market.To solve the conundrum and learn the year’s lessons, we must view the storms, fires, and floods of 2017 in a long-term historical perspective. We should not use loss data alone to define weather and climate trends; we need to also understand the impact of the growth of global wealth, as well as patterns of weather extremes.When we do so, we find that the record-breaking losses were not so enormous, and could have been worse. About $92 billion of 2017’s insured catastrophe losses arose from three major hurricanes according to the latest Swiss Re Sigma Report. When indexed to 2017 values, Hurricanes Katrina, Rita, and Wilma in 2005 caused insured losses of $112 billion.We also need to consider that extreme weather memories are typically short. Catastrophe models that simulate the impact of historic storms in today’s built-up environments show that events such as 1926’s Miami Hurricane or the 1928 Okeechobee Hurricane would cause insured losses that surpass those of 2005 and 2017 hurricane losses. When other named storms and natural catastrophes that occurred worldwide during those years are included, the insured impact on our modern built environment would easily exceeds $140 billion.
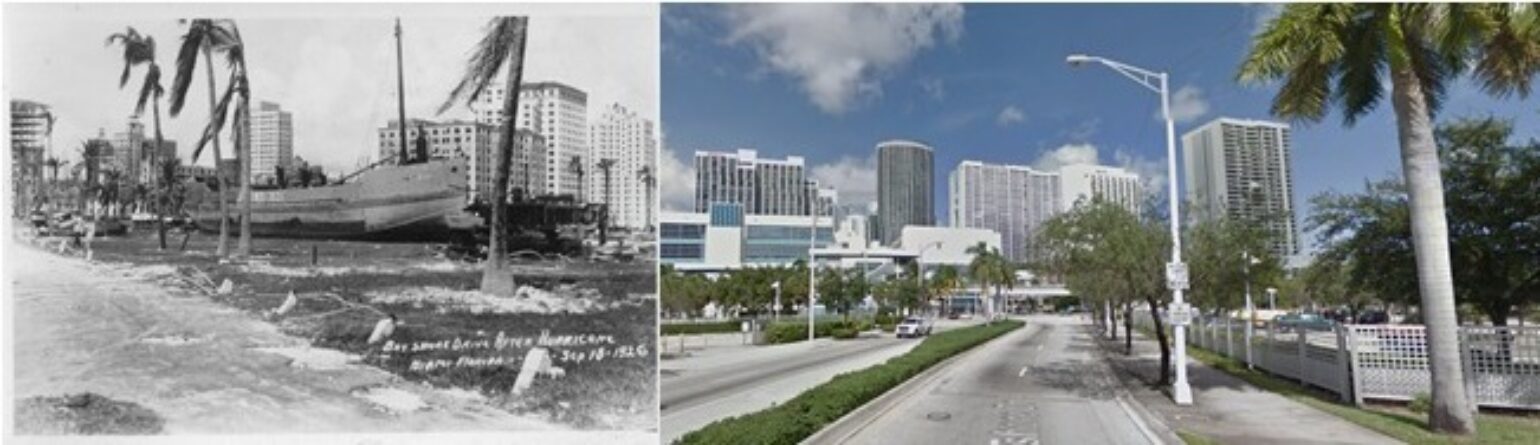
Bay Shore Drive in Miami then 1926 after Hurricane and Now. Source NOAA and Google Street View.
Meanwhile there is a perception that extreme weather patterns may be changing. In some cases the data supports this perception. It is likely that, since 1951, the number of statistically significant regional increases in heavy precipitation events is greater than the number of declines. Strong regional and sub-regional variations modify the trend, but in short, when it rains it often rains more. However, despite the increase in these extreme precipitation events, little evidence suggests the rainwater has led to an increase in floods, with lots of regional variations.
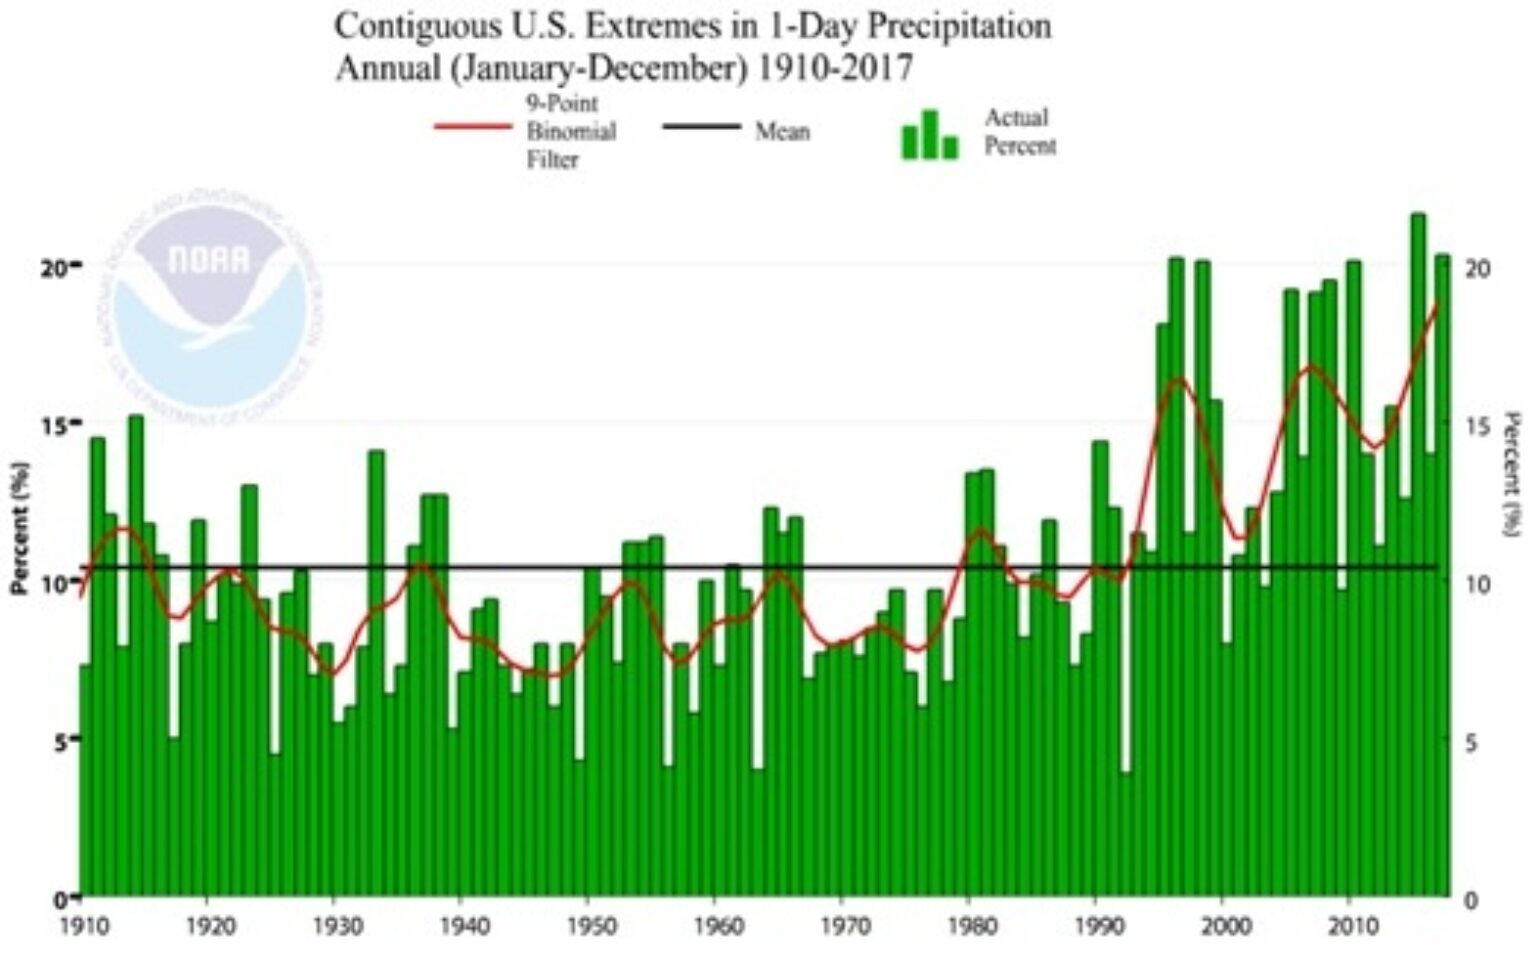
The U.S. Climate Extreme Index quantifies the observed changes in one-day precipitation extremes across the U.S. Since 1990, there has been an increase in the area of the U.S. that has experienced a one-day extreme rainfall.
Tropical cyclones seem not to be changing. After accounting for past shifts in observational capabilities over time, the best records that started in the 1970’s suggest, globally, there are currently no significant observed trends in the number of named tropical cyclones, but the data is suggesting that, when named storms form, they have become stronger in recent years.
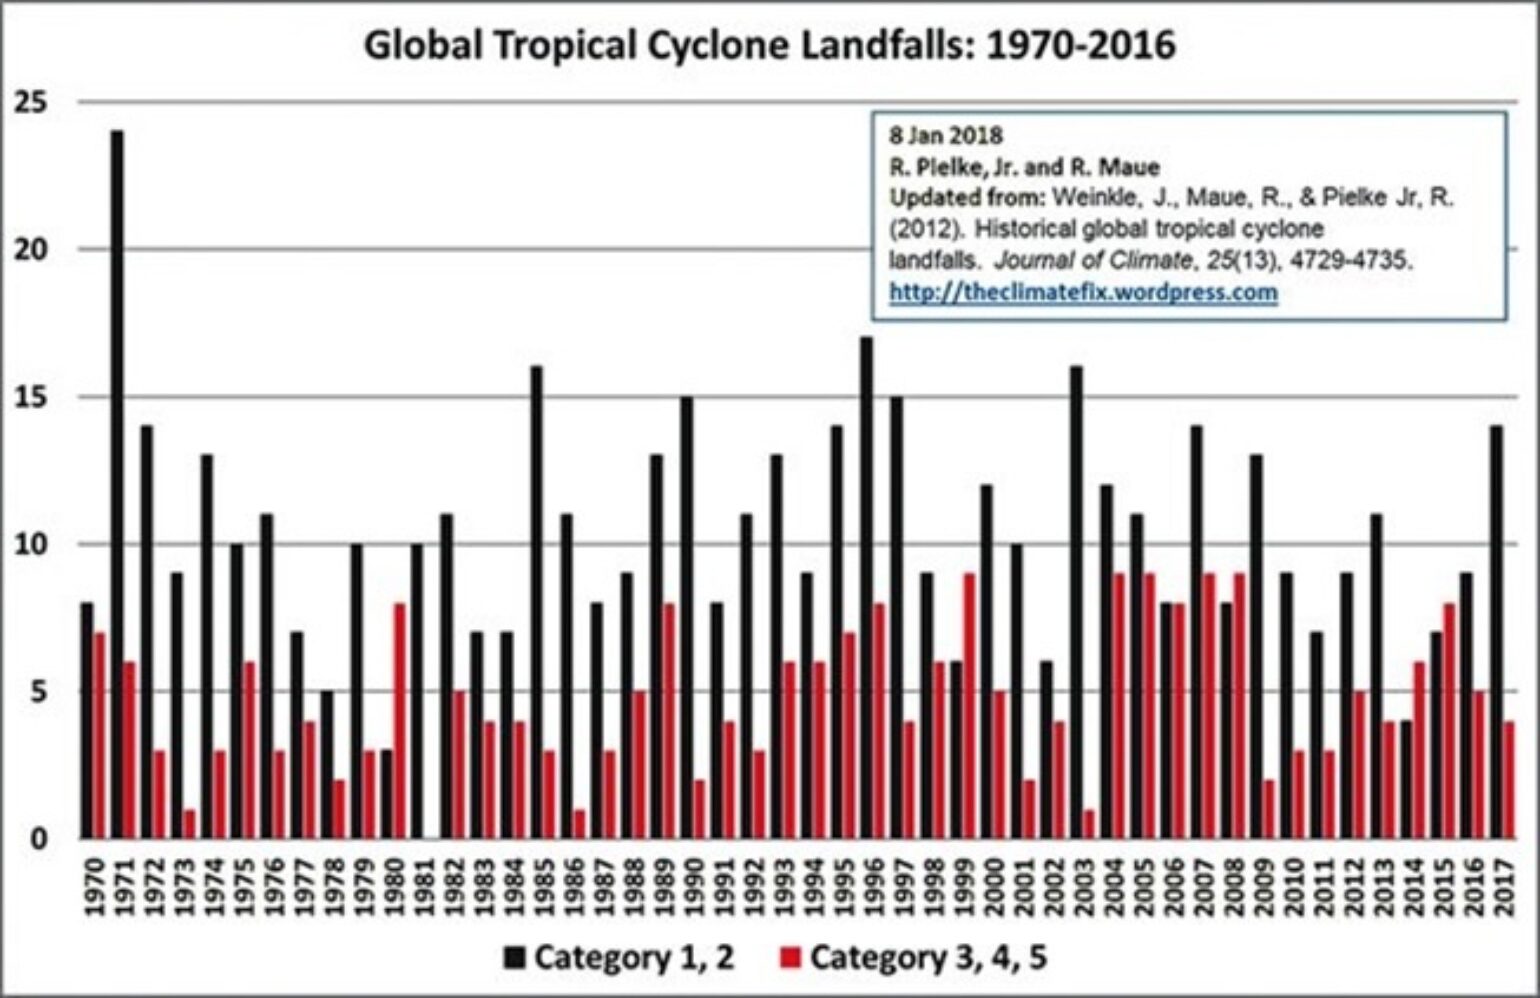
2017 had 18 total landfalling named storms. 14 of these had a category 1 or 2 and four of the three major categories were in North America. As for severe weather, poor data quality makes conclusions about long-term trends problematic. Observed trends in small spatial-scale phenomena such as tornadoes and hail can be made with only low confidence levels, but more recently the data is suggesting clearly a downward trend in the number of occurrences of major tornadoes.
A lot of talk today about the anniversary of the April 2011 Super outbreak. With Joplin later next month many said after 2011 we would see more frequent major tornadoes. Here is the trend which shows a noticeable downward trend since 2011. #MajorTornadoDrought. — Andrew Siffert (@AndrewSiffert)April 27, 2018
With all this in mind, we should learn lessons from the 2017 experience.
- Whether it was the major wildfires in California, flooding of Harvey, the extreme winds of Irma over south Florida, or one of the many damaging hail storms; exposure management is very important and there needs to be a refocus on this simple task to limit losses.
- Valuable data will be collected from the 2017 events, especially from the high wind speeds from HIM. This data will fill critical gaps in the historical record and will be valuable both meteorologically and financially, as it will help insurers and customers by providing better loss models, and lessons for loss mitigation and resilience.
- Building codes matter. When wind-speed data is combined with claims data, we get critical knowledge of how high winds damage different types of construction. We now have validation for some wind-tunnel testing which has been lacking due to the lack of hurricane landfalls over the last decade.
- Hurricane forecast track and intensity still have a great deal of uncertainty. The 2017 landfalls raised questions about the value of early landfall loss projections, and how they could be used.
- Effectively, the people who need flood insurance do not have it. How many more flood events like Harvey and Katrina do we need before more action is taken?
- Companies with the best business interruption (BI) insurance came out on top after an event, but few small businesses don’t have enough BI.
- Demand for certain post-event services seriously tested supply. The lack of adjusters, for example, created a major bottleneck that led to very high loss adjustment expenses.
- Given the long 10 years without major hurricane landfalling activity, 2017 was a great systems test for InsurTech. It would appear no major lapses in these new technologies have occurred which should further expedite system enhancements in InsurTech.