T- 72 hours
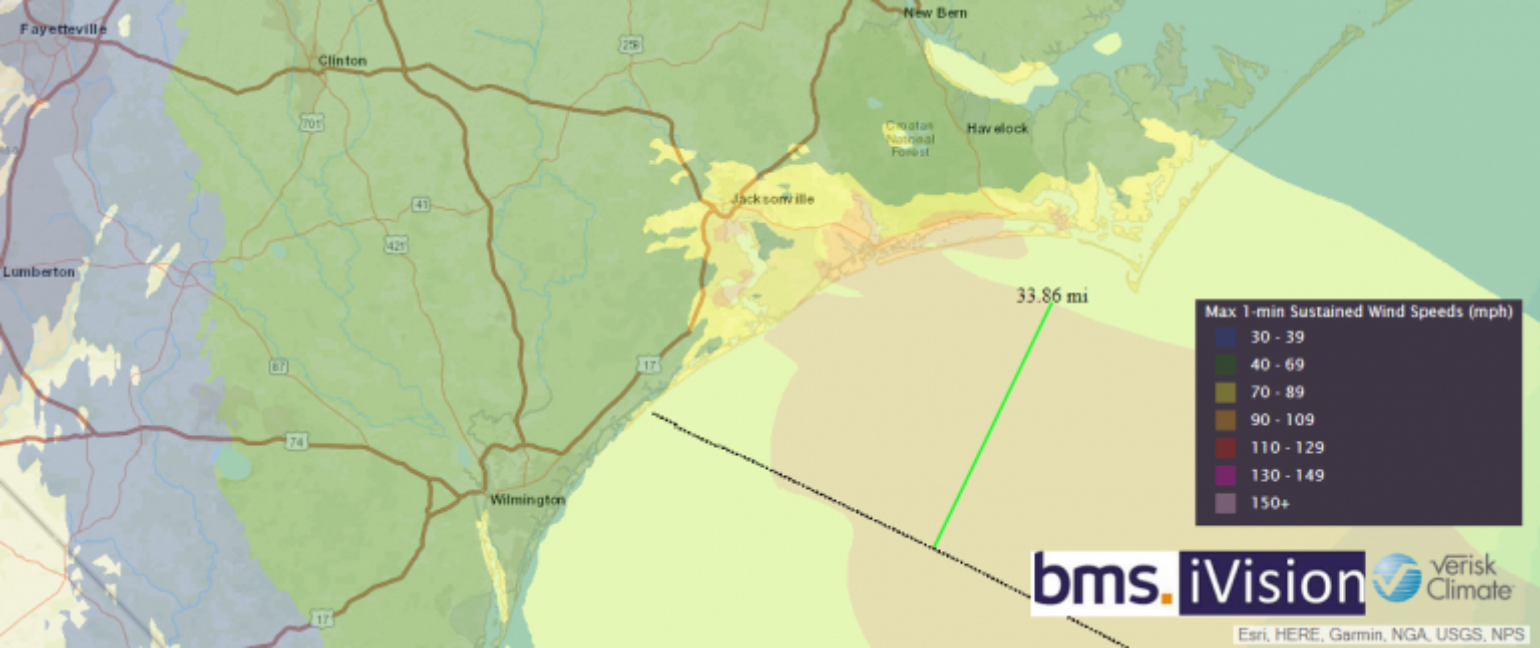
Although yesterday I mentioned that Florence is not just a point on a map and will have a wide-ranging impact far away from the center the storm, the center does still matter. With Florence about 72 hours away from its expected landfall around 7:00 a.m. AST on Friday, there is still some uncertainty regarding the exact landfall location. Florence continues to fluctuate in intensity with winds of 130 mph, along with stronger gusts. The diameter of the most destructive winds, known as the radius of maximum winds, is currently only 10 miles, but will likely continue to grow. The plot below is from our BMS iVision application with the Verisk Weather Solutions wind one minute sustained swath. This is only one possible forecast scenario, but it provides an idea of what the wind field could be. This will shift north or south based on the eventual track, with the strongest winds likely being on the right side of the track. If these maximum winds occur over a more populated area, the damage will be much greater. For example, the losses from last year could’ve been a different story if the strongest winds from Hurricanes Harvey and Irma hadn’t just missed the populated areas of Corpus Christi, TX, and Miami, FL, respectively. At this point, the forecast still holds that Florence will make landfall between Myrtle Beach and Morehead City, NC as a strong Category 3 hurricane with winds of 120 mph.
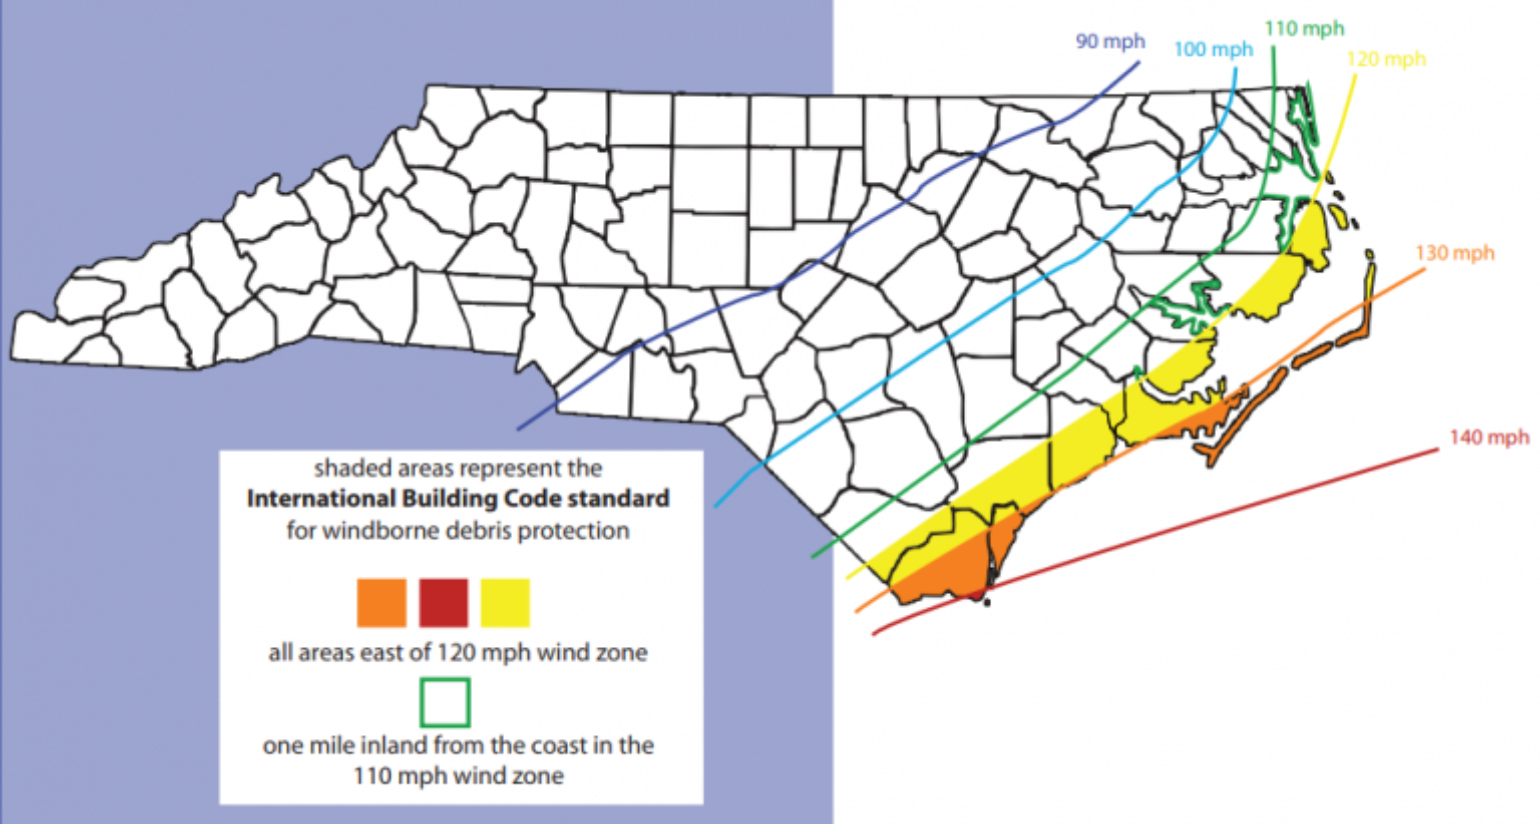
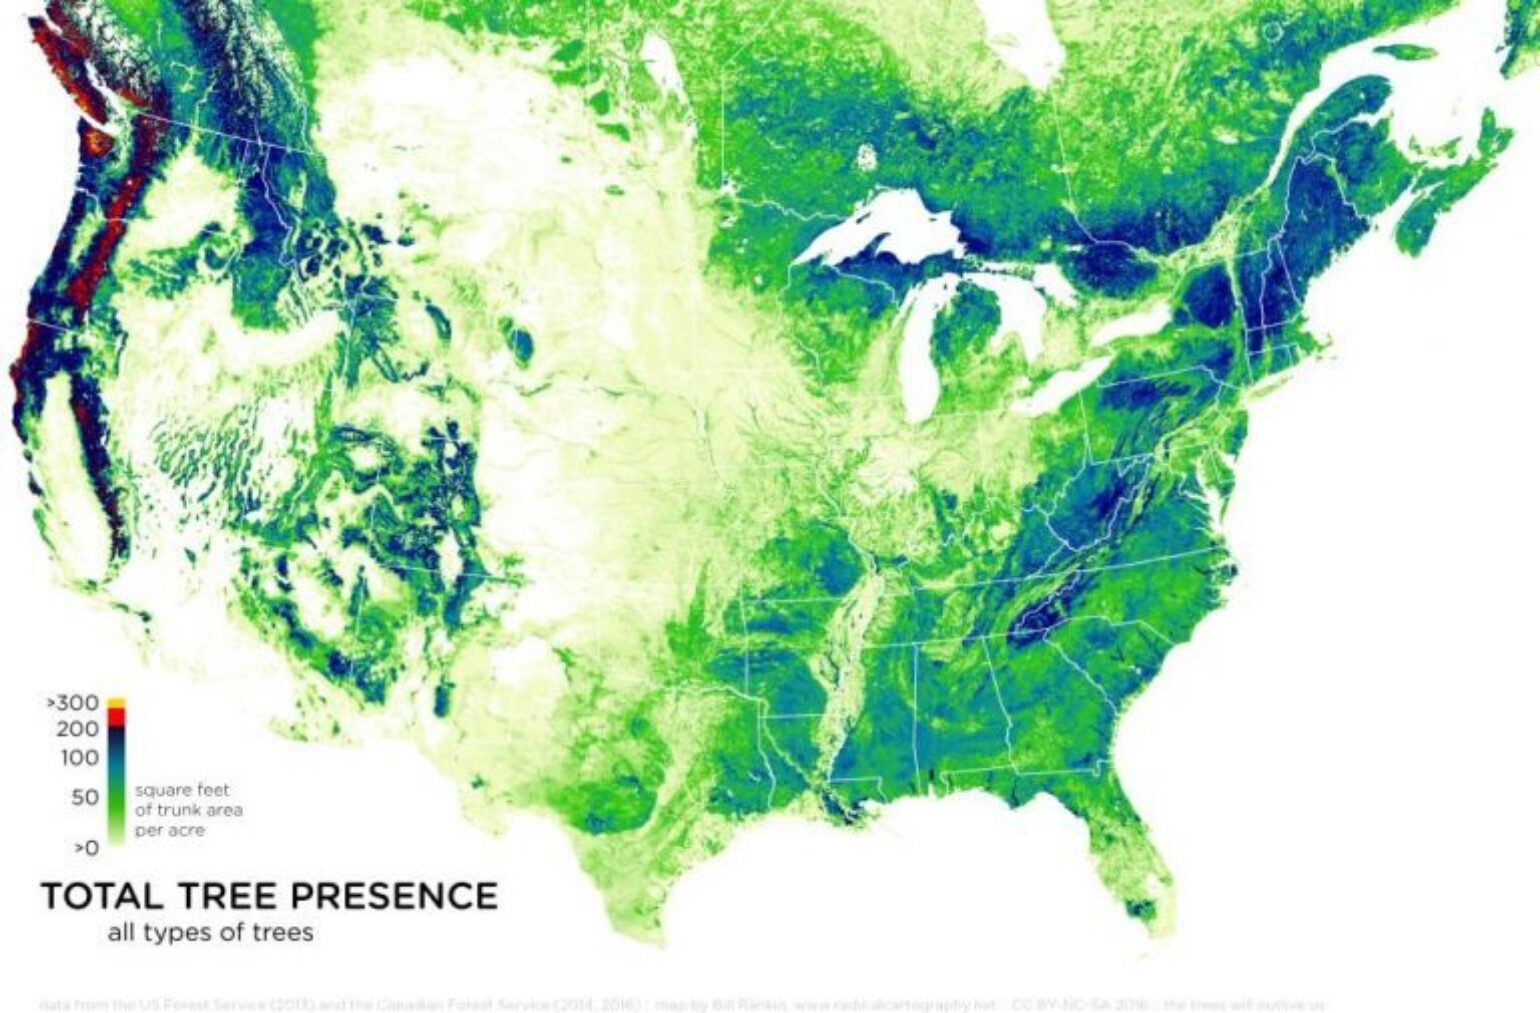
If Florence comes ashore with winds of 140 mph as previously forecasted by the NHC, this would be above the International Building Code standards, which are the strictest right along the coast. However, hurricane-force winds will likely extend up to 30-60 miles inland, with tropical storm-force winds extending even further. These wind gusts will be strong enough to cause power failures as far north as Virginia and, given that it has been decades since a major wind event has impacted this area, it’s likely that a lot of old, damaged and diseased trees will be cleaned up. These strong winds, combined with the wet soil conditions over the last month, may lead to a high likelihood of wind-related treefall damage.
Flooding Potential
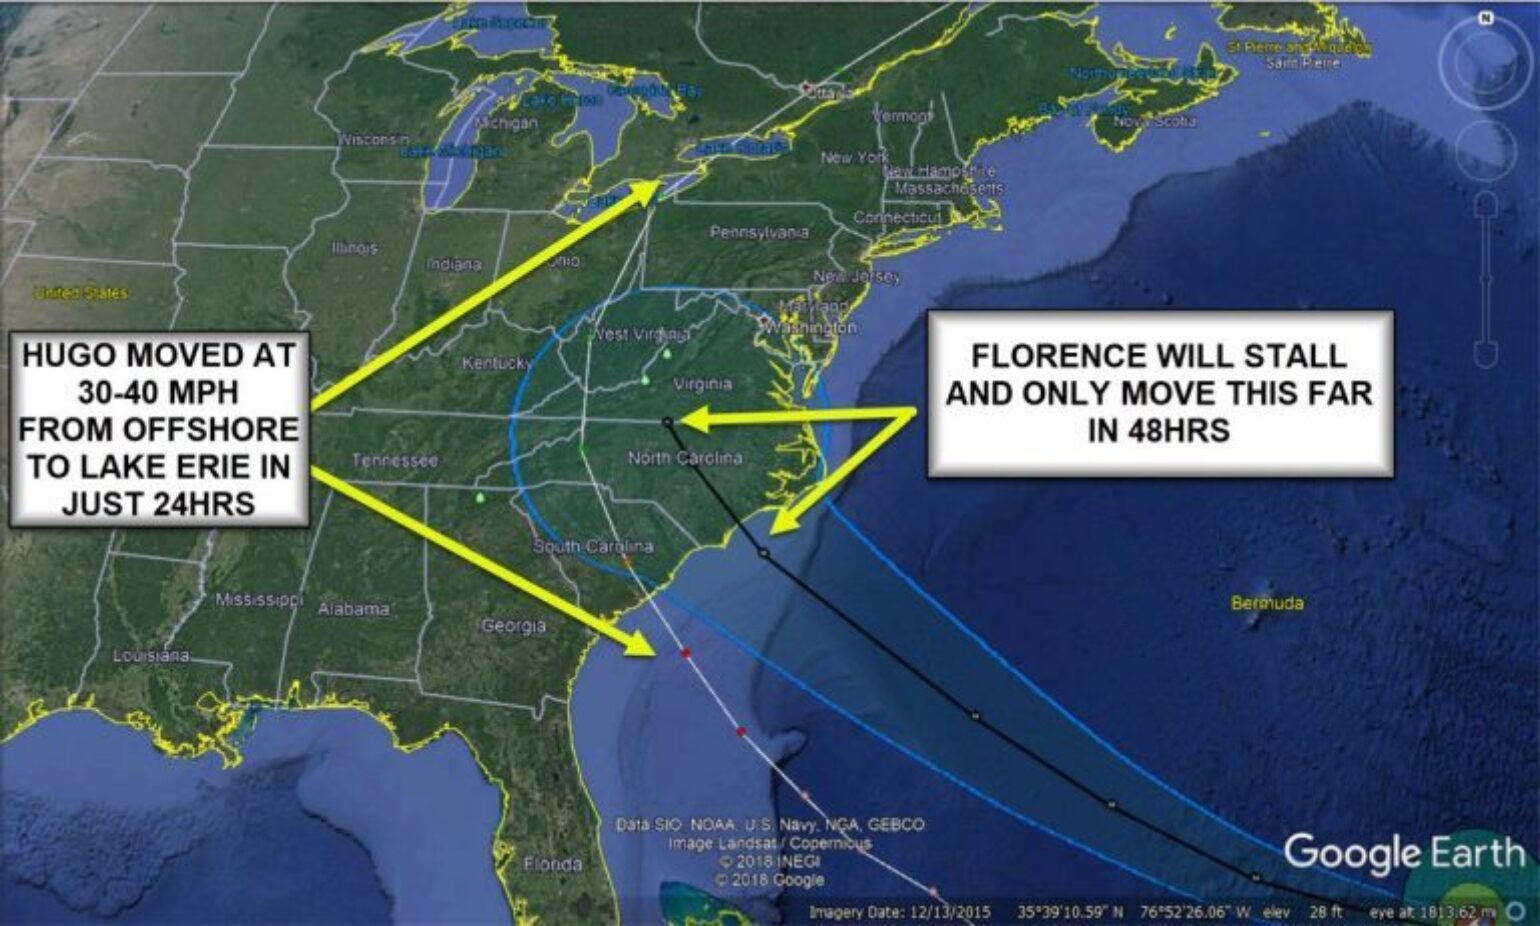
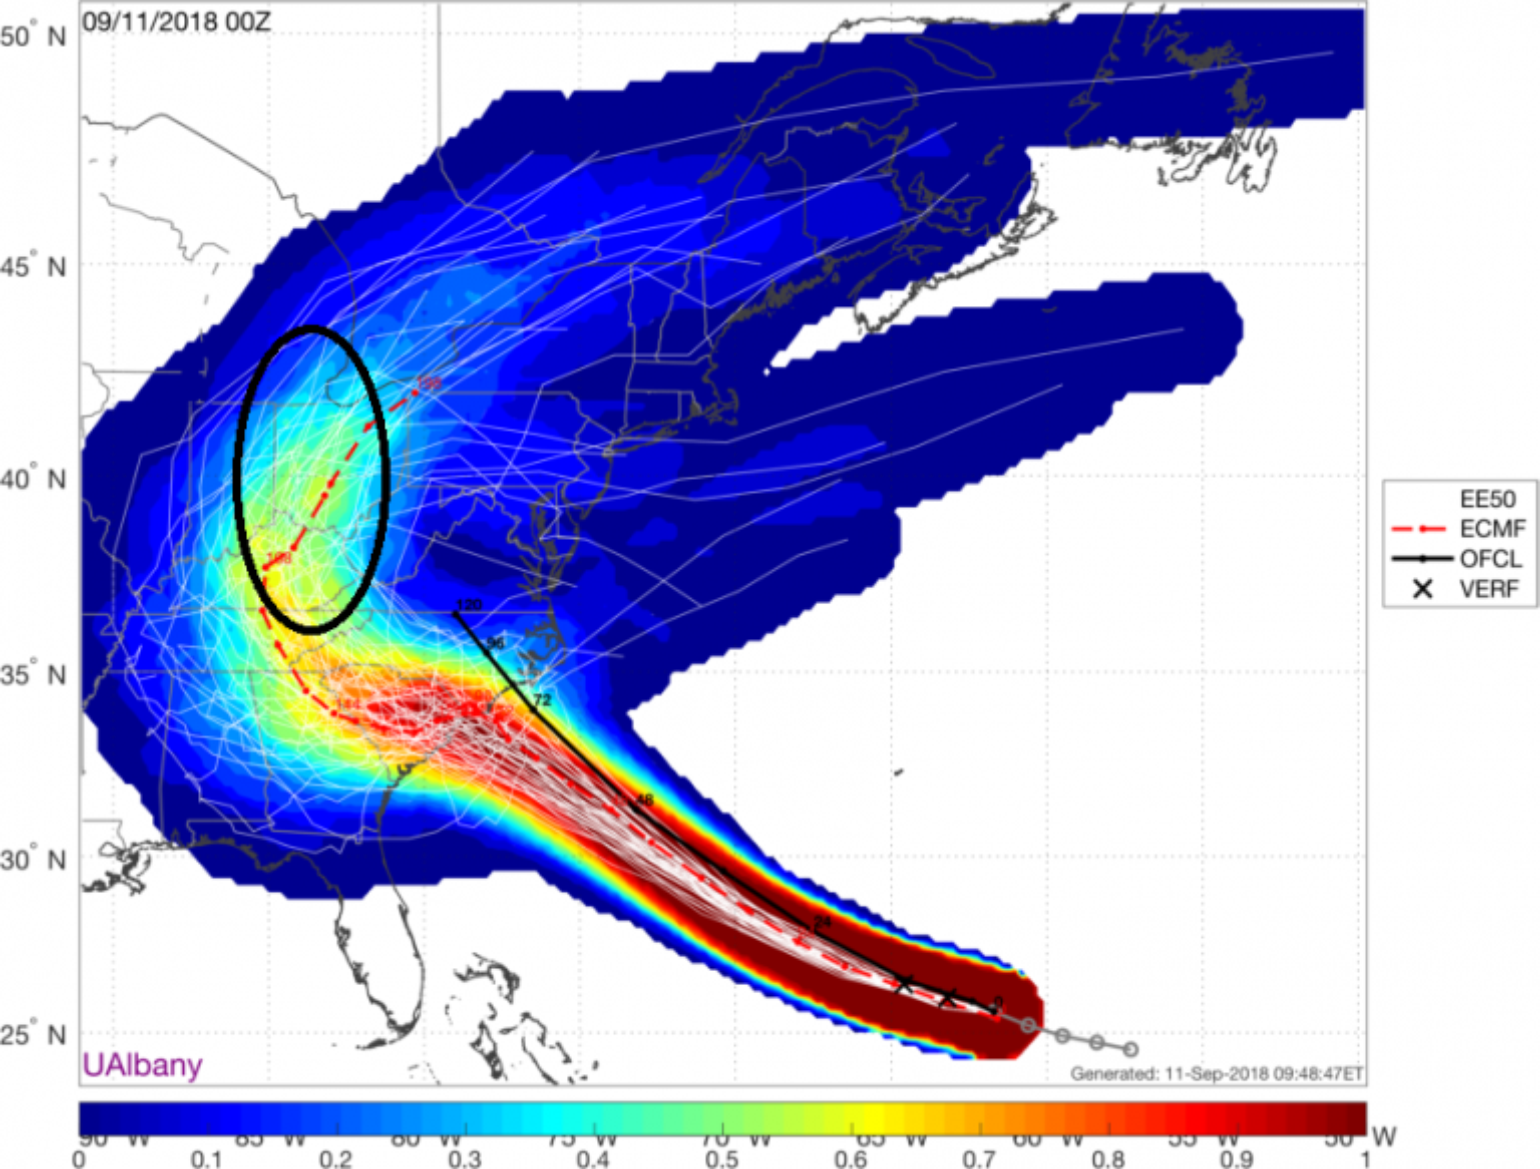
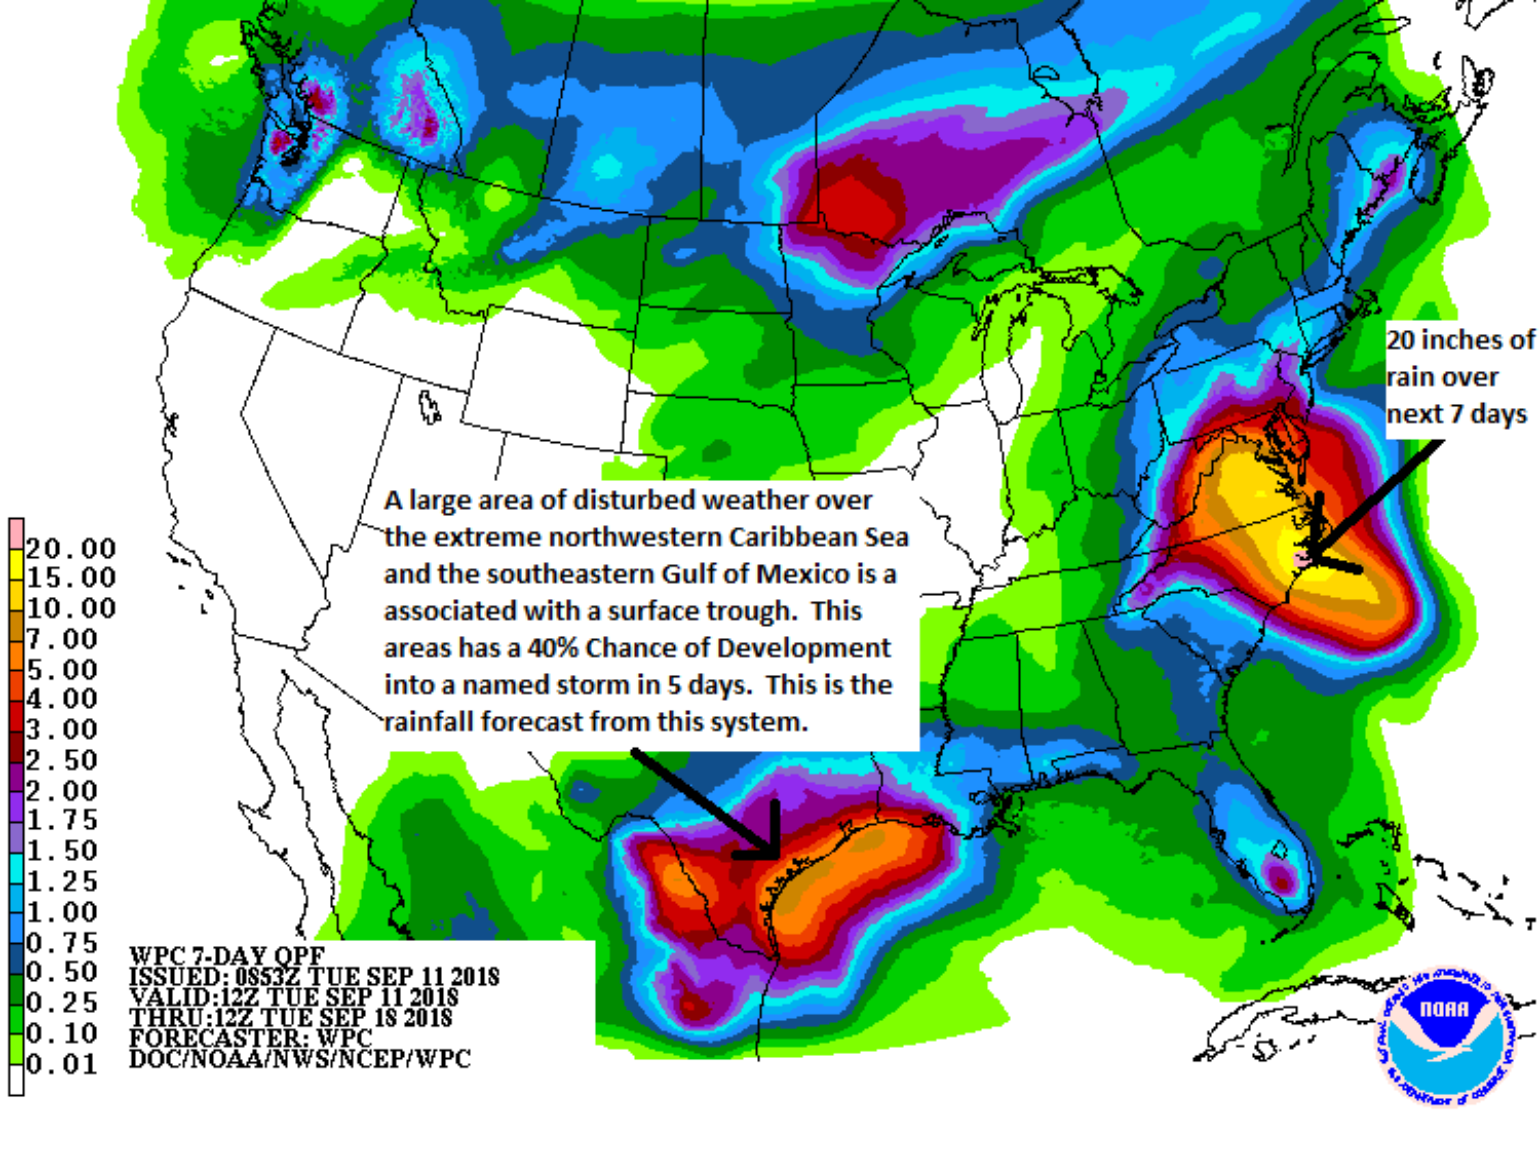
It appears that the forecasted track for the center of the storm and the NHC cone of uncertainty are getting closer together. The primary reason for the slow movement after landfall is a strong blocking ridge of high pressure to the north. This will cause Florence to potentially behave erratically this weekend, similar to what happened with Hurricane Diana off the Southeast coastline in 1984. The major issue with stalling is that a large amount of rain is forecasted to fall. The spread in model rainfall forecasts has increased since yesterday. It is likely that a maximum of 20 inches could fall, but this all depends on how long Florence stalls and what type of orographic influences occur in the more complex terrain further inland. The North Carolina state record of rainfall from a named storm is 24.06 inches from Hurricane Floyd in 1999.
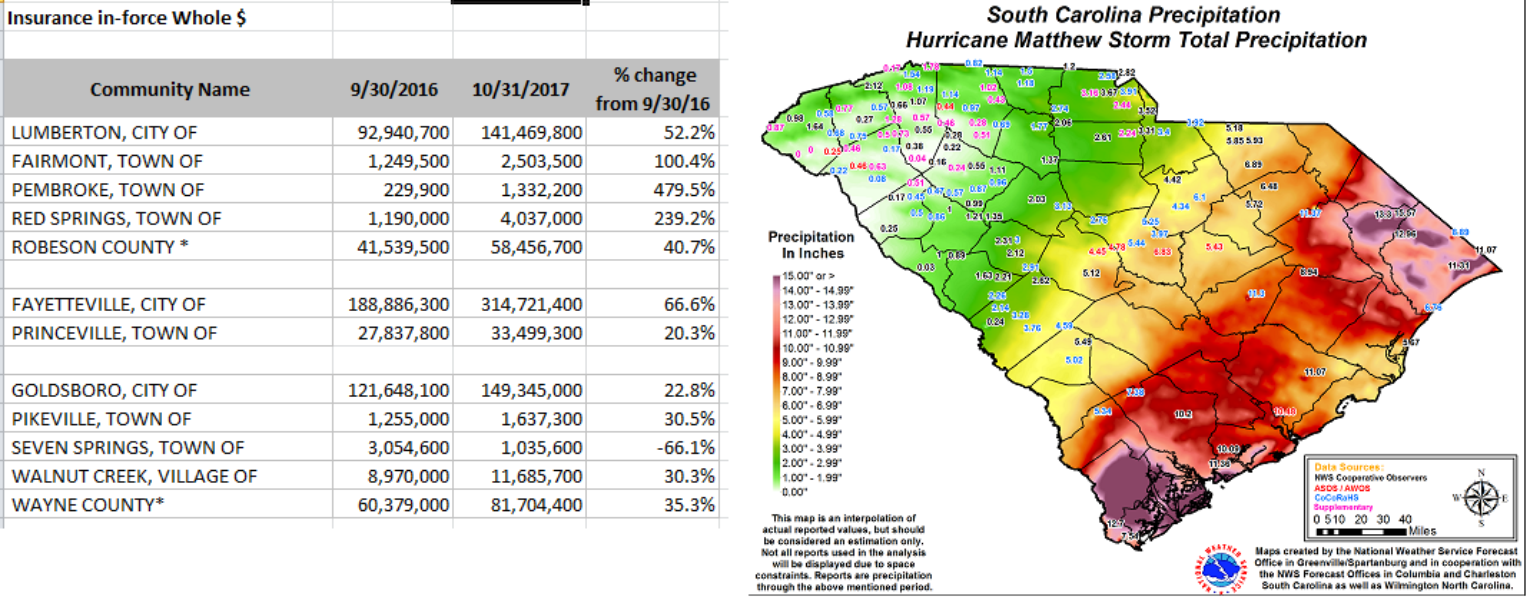
Because of the wetter-than-average conditions recently, dams may not be able to contain the rainfall and areas that have never flooded before will likely flood. Unfortunately, in October 2016, Hurricane Matthew brought heavy rainfall and flooding to North Carolina. The story is the same after every major flood event – many of those affected were without flood insurance. North Carolina is a leader in floodplain mapping and risk communication, and the recent major flooding from Hurricane Matthew provided a reason for consumers to get flood protection. According to the following data, nearly 300 North Carolina towns, cities, and counties increased the number of NFIP policyholders since 2016. Seventy remained steady, and 130 saw decreased participation. Not surprisingly, coastal communities are the biggest participants in NFIP. Most notably, Fayetteville had a whopping 65% increase in the number of policies, albeit only to 1,290 (the 2010 Census documented 87,000 housing units in the city), which still shows a very large protection gap. Other large cities saw increases, including 10%+ increases in Charlotte, Durham, Raleigh, and Greensboro. If there is any good news here, it’s that more flood coverage has been provided and NFIP has reinsurance to aid in its expected losses. However, large protection gaps still remain.
Storm Surge
The NHC has started to issue watches and warnings this morning, and with that they have issued the first storm surge watch for Florence. The combination of a dangerous storm surge and the tide will cause normally dry areas near the coast to become flooded. Surge-related flooding depends on the relative timing of the surge and the tidal cycle, which can vary greatly over short distances. The NHC has now started to issue storm surge inundation maps and they should be watched closely. It’s likely that the current inundation levels of greater than nine feet above ground will likely grow.
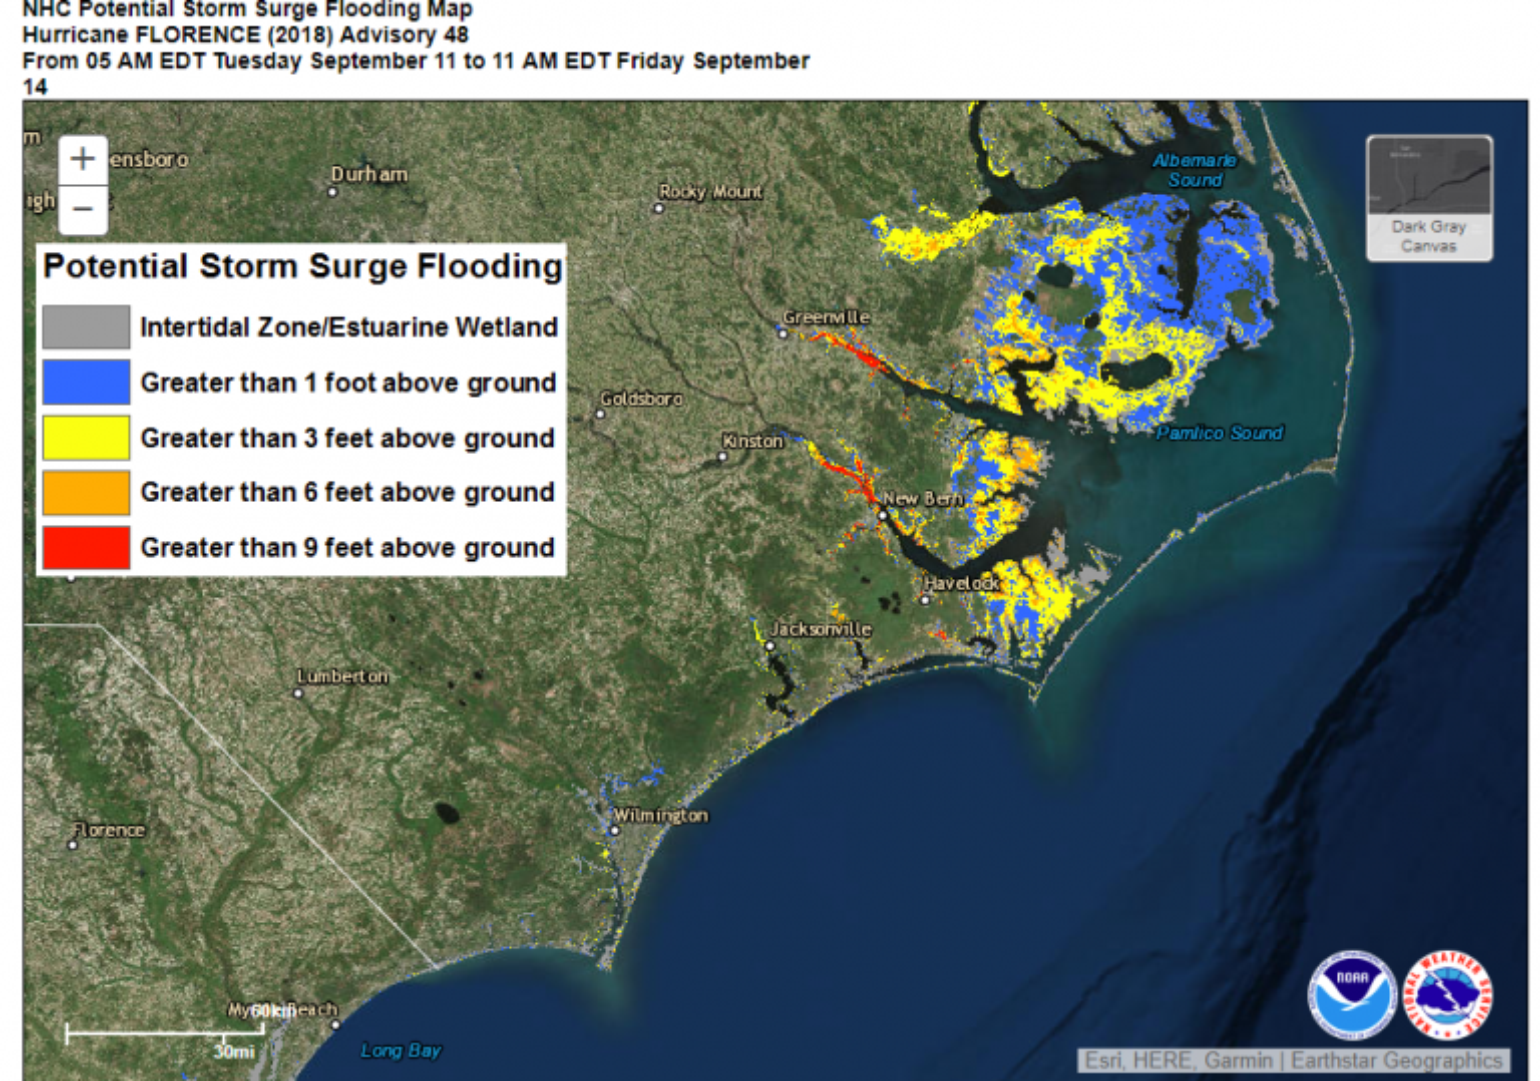
NHC Potential Storm Surge Flooding Map[/caption]
This is located at the Wrightsville Beach Museum. #Hazel literally is heads above the rest! pic.twitter.com/MMlWU1Ake3
— Met. Eclipse (@TARCweather) September 10, 2018
Insured Loss
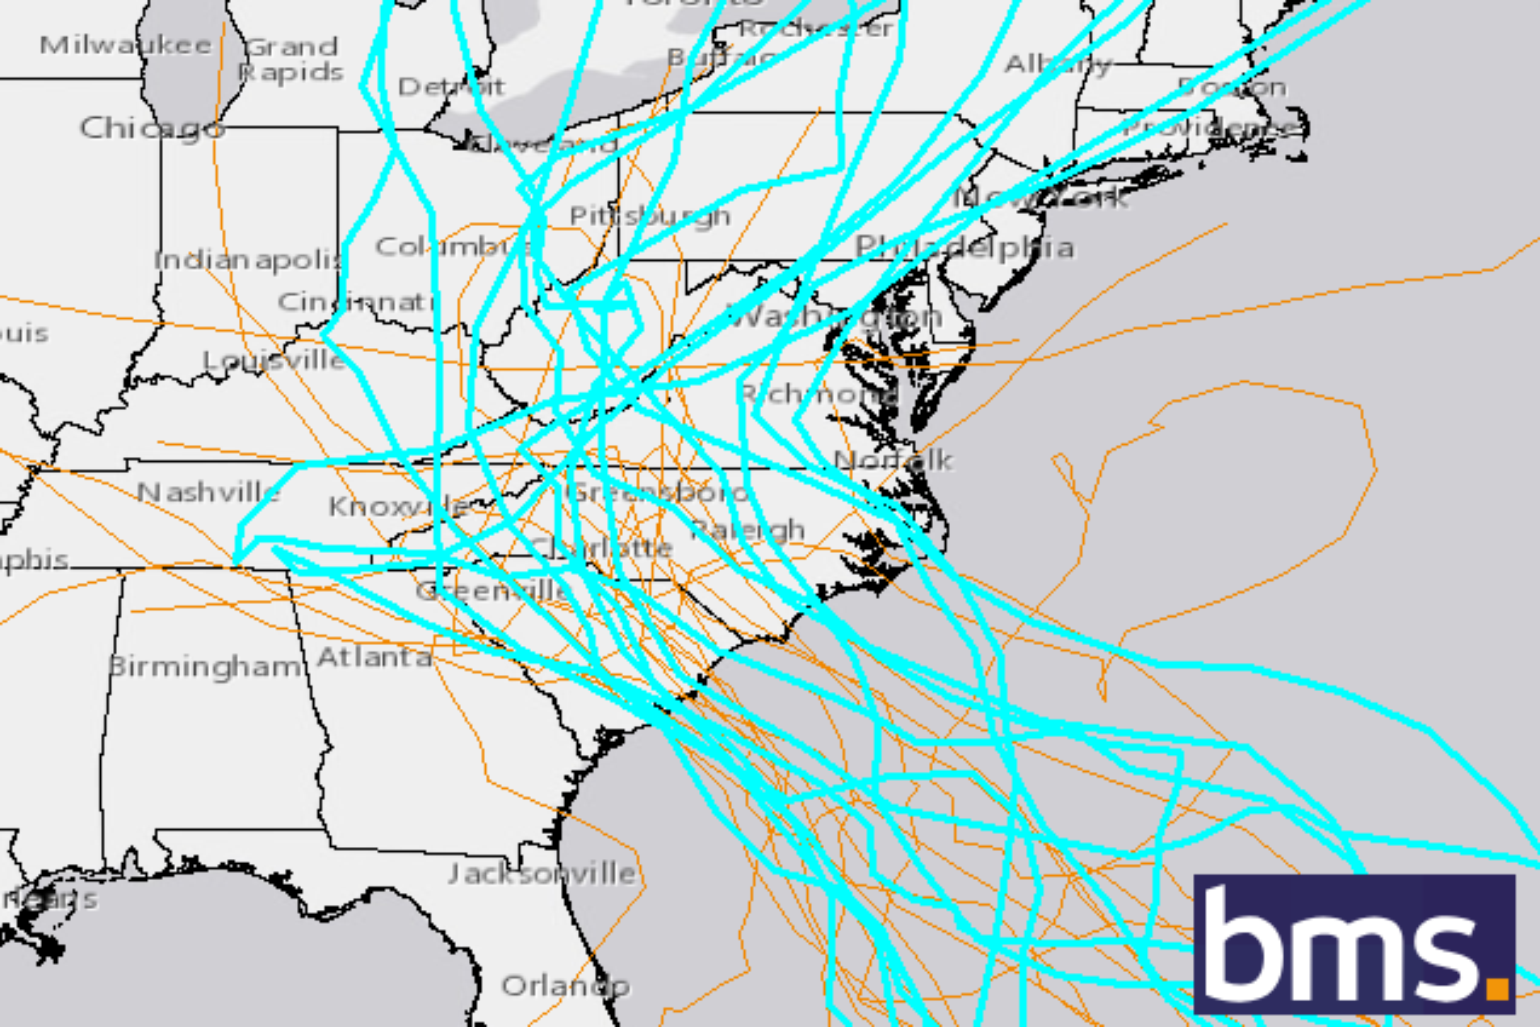
There are several reasons why the insurance industry needs to understand the potential loss from Florence. Insurance companies are looking to understand the size of loss relative to their reinsurance placement. They also might be looking to buy top-up covers or 3rd or 4th event covers, if needed. There is also the need to understand where to stage claim adjusters or if third-party adjusters might be needed. The reinsurance industry is keen on triggers of ILW, Cat Bonds and retro needs. There is also an active LiveCAT market for the industry to buy or sell extra capacity. With the understanding that some catastrophe modeling companies usually don’t issue insurance industry loss guidance until about 48 hours before landfall, curiosity often takes people to GIS and the various stochastic track sets to see what potential losses might be. However, Florence’s expected stalling makes event loss selection more challenging, as many of these stochastic track events often move into the Northeast as climatology would suggest. Therefore, only losses from the Southeast should be used to limit losses that might occur from events that track further inland up into the Northeast. Also, given the general cone of uncertainty 85 hours before landfall, the loss ranges can be quite large. This is primarily driven by events that track over more urban coastal areas versus those that track over less populated areas. There are clearly some large loss scenarios with events that could hit Myrtle Beach, SC, and Wilmington, NC, which could easily reach into the billion dollar range. The most extreme loss scenarios at this time are from Charleston, SC, which is slowly becoming an unlikely scenario.
