By Andrew Siffert – Vice President / Senior Meteorologist
California is on fire again and no one should be surprised. Wildfires seem to grab our attention all over the world. From Siberia to Australia, from Greece to western North America, wildfires burn and have done so for centuries all around the world. And there is no doubt there is a human-caused element; whether it is from ignitions of downed powerlines, careless discarding of a cigarette, or gender reveal parties these human factors only add to the larger crisis that is going on. In many of the wildland areas around the world, wildfire is inevitable, but widespread devastation does not need to occur.
The underlying causes of these fires are complex and varied. A warmer climate appears to be a big one that is used in the media because it is easy to point a finger at. But what is harder to point a figure at is the more than a century of land-use practices that allowed communities to be built in harm’s way, and the flawed view that wildfires should be “fought” rather than lived with, managed, and used. There is still not enough press around this subject. In fact, at the 2020 RAA Cat Modeling Conference John Phipps, the Deputy Chief of the U.S. Forest Service, presented a talk about “Wildfire: The Present, The Future and What Needs to be Done”. His opening slide comment was that American fire problems are primarily caused by human activity on landscapes and within communities. Climate change exacerbates this problem, however, it is not the main cause. His talk went on to describe what earlier settlers saw when they settled the western U.S. He talked about how early forested areas of the west had about 50 trees per hectare, but after over a century without fire due to fire suppression, today up to 1,700 trees are in the same forested areas. He showed a great picture from Leiberg 1899 in the Bitterroot Valley, Montana. At the time it had a nice open forest, but today the forest is very dense. Here is another example.

Wildfires used to be more frequent and had low fuel loading, which results in mainly low-intensity fires. However, today the landscape is drastically different. Fires have changed as a result of fire suppression as the dominant strategy to fighting fires which has resulted in less frequent fires that are larger and more powerful due to higher fuel loads. This is all complicated by the fact that nearly 2 million residential homes are in high wildfire risk zones.
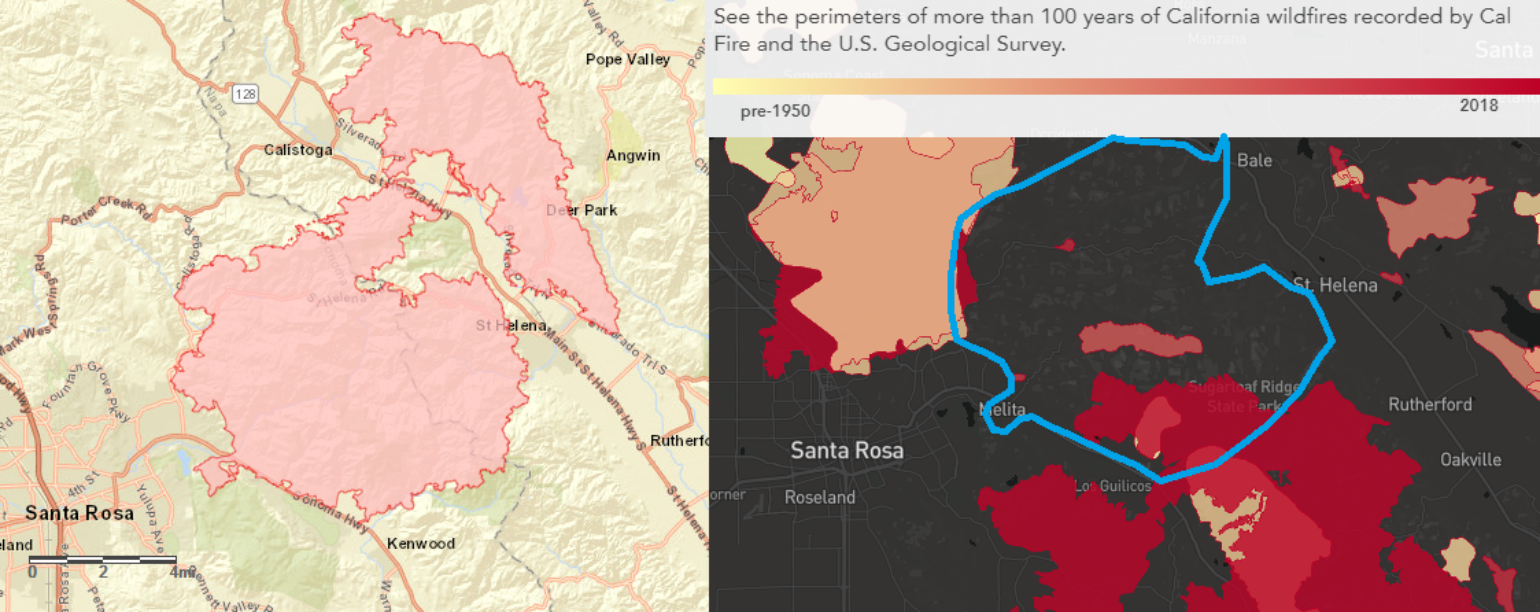
To illustrate the point consider the recent Glass Fire that occurred just east of Santa Rosa, California that has already burned 61 structures. BMS iVision shows the updated National Interagency Fire Center (NIFC) Glass Fire wildfire perimeter. If you compare that with the historical wildfire perimeters then you will see the current wildfire area has not burned in the last 50 years. So sure, fire conditions were extreme due to weather, but the fact that this area has not seen a fire in 50 years is the real reason why it burned so fast towards East Santa Rosa in the early morning hours of September 28th.
Further to this, UrbanStat.com has done some research that says about 72% of the areas which were hit by wildfires in California had never experienced a wildfire in the last 50 years. Their research concluded that it takes 17.3 years on average for the second fire to occur in these wildfire areas, with a minimum being a few months and maximum being 48 years. To help the insurance industry they have provided the probability of a previously burned location to experience another wildfire at about 0.57% and this is about 16% lower than the probability of a fire occurring on a location that was never impacted by a wildfire.
Although other factors can influence wildfires, such as the type of vegetation/fuels and slope/topography, we know that the problem is complex. New research suggests an increasing likelihood of extreme autumn wildfire conditions across California. The research finds there is a historical increase in autumn temperature and decreases in precipitation that has led to an increased number of days where the aggregate Fire Weather Index (FWI) exceeds the historical 95th percentile, which is strongly associated with large wildfires.
So besides needing a different approach to managing wildland areas that would result in low-intensity good fires as a means of preventing catastrophic fast-moving mega-fires, what else can we already learn from the 2020 wildfire season? We do know that the wildfire season has been different on many different levels. One of the main differences that occurred with the wildfire of mid-August was the fires were more natural and caused by the remnants of tropical cyclone Fausto in the East Pacific Ocean, which provided dry instability at upper levels of the atmosphere. This created dry lightning storms that resulted in over 20,000 lightning strikes and explains the number of fires that were started. This also explains why so many acres have burned year to date in California. Because some of these fires are in more natural areas, various wildfire managing agencies have allowed for more natural wildfire management to occur. This is a good thing as discussed above. It should be noted that due to COVID-19 there is more of a strain on fighting these fires. An example of this international firefighting support has been limited this year due to travel restrictions, in past years thousand of firefighters would come from all over the U.S. or other countries to help with fighting fires efforts this year. This has likely also played a role in the larger than normal acreage and higher property loss this year for the insurance industry.
Unfortunately, the level of insured losses looks to be high. So far an estimated 13,500 structures have burned. To put this in comparison, 2017 had 10,800 structures burn and 2018 had 22,700 structures burn. The average personal property claim from the major fires of recent years is $256,000, so if you just simply take that number by the estimated 13,500 structures it results in a loss close to $3.5 billon and this does not even account for the auto commercial losses, the smoke, evacuation, and loss adjusting expense, and the business interruption losses that will likely be added.
The fires of 2020 are also allowing for more lessons around the cruelty of fires once the fire approaches the Wildland Urban Interface (WUI). Time and time again this year there are images of a given property fully engulfed while other properties are unharmed.
https://twitter.com/arasmusKTV...
There are more and more examples of how wind-driven embers are getting into places that can start these fires. This can happen in an indiscriminate manner, but the Insurance Institute for Business and Home Safety (IBHS) is trying to help. They have just released a Suburban Wildfire Adaptation Roadmap which provides decision trees that show the range of possibilities and what to avoid. The insurance industry has a role here to help homeowners take action, and ultimately whole communities can take actions that can reduce the risk curve and limit the catastrophic reach of wildfires.
Some of the worst wildfire losses for the insurance industry have come in the fourth quarter, such as the Oakland firestorm of 1991 that occurred on October 19th. These fall fires are more frequent as Santa Ana and Diablo winds occur. These warm-hot winds can drive fast wildfires as we have seen in years past, and most recently this past weekend with the Glass Fire. The long term forecasts call for hot-dry conditions to continue across California. This hotter drier weather will likely be aggravated by La Niña conditions that have developed in the Pacific Ocean. La Niña typically turns Southern California dry and hot if it is stronger. However, La Niña is never a sure bet. A weaker La Niña, like the one that occurred over the winter of 2016 and 2017, brought record rainfall to the area resulting in the Oroville Dam crisis in February 2017.
Typically, La Niñas are often associated with colder, stormier-than-average conditions, and increased precipitation across the northern parts of the U.S., and warmer, drier, and less stormy conditions in the southern portions of the country. There is a potential that a dry winter may result from La Niña, which would not be good news for this fall or going into the 2021 wildfire season.
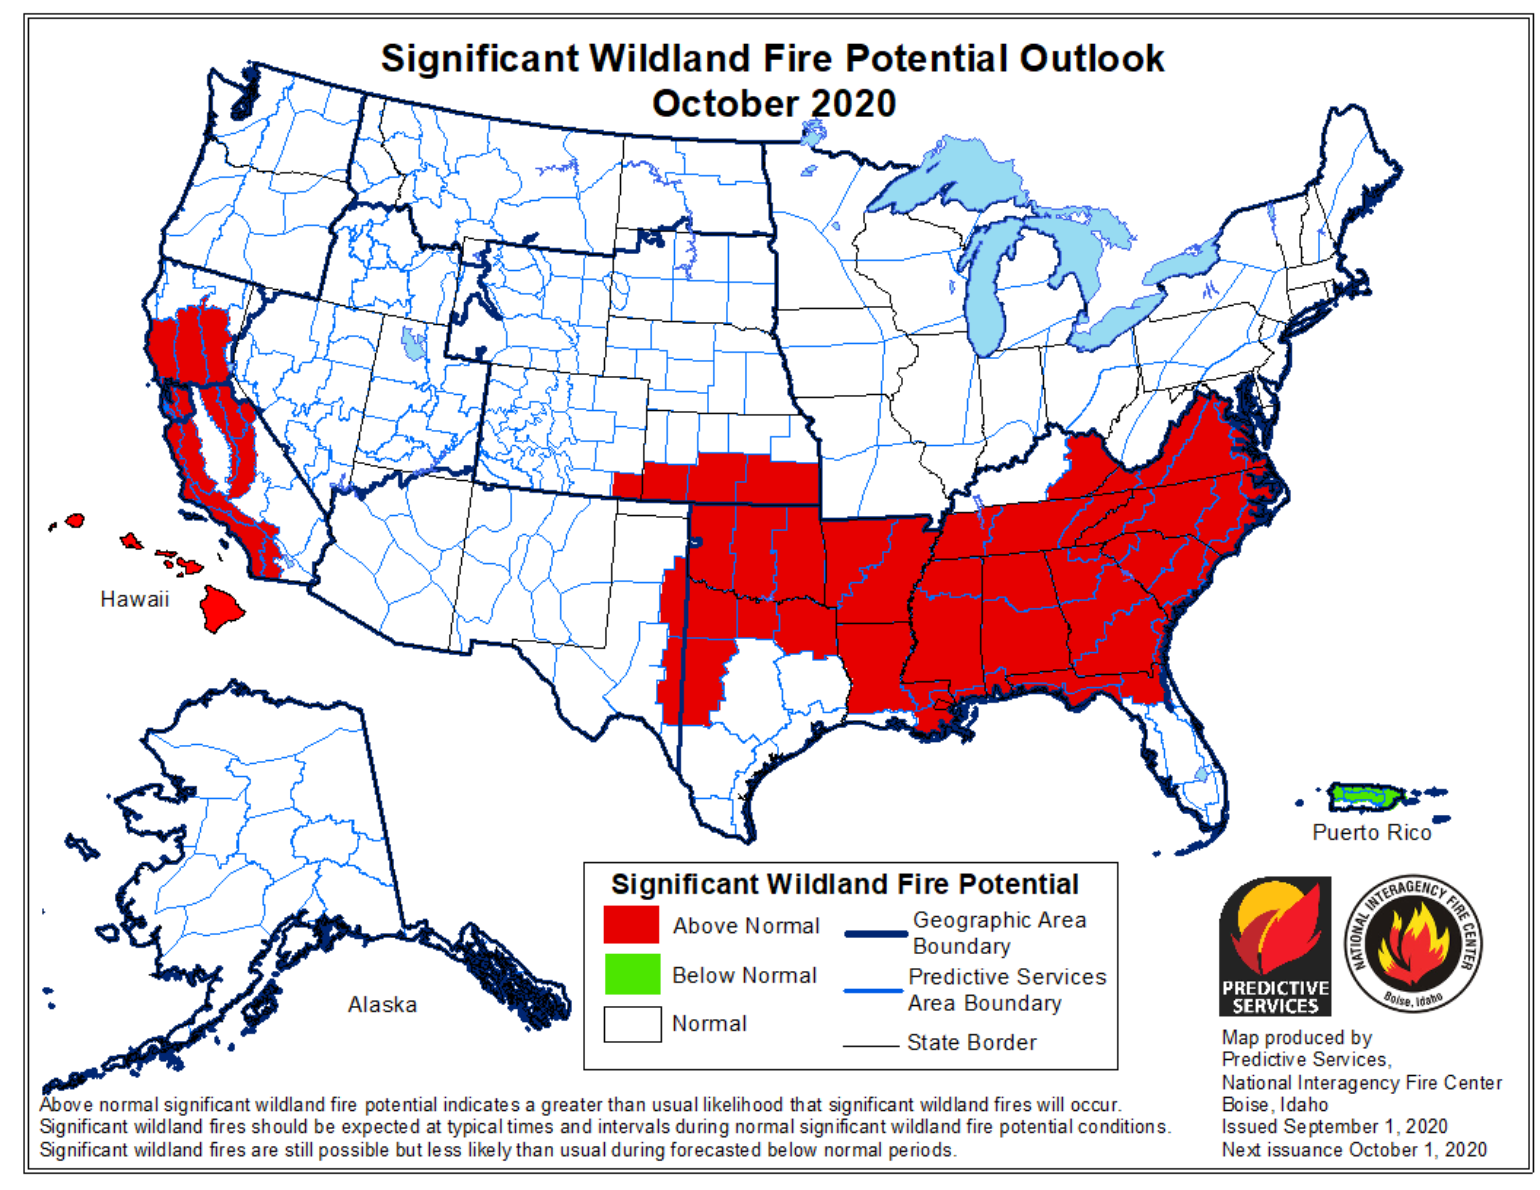
The short term forecast calls for a possible pattern change in the middle of October with maybe even some rain from the remnants of hurricane Marie in the East Pacific. However, in the longer-range The NIFC predicts an above-normal potential for “significant” wildfires in parts of California for the next two months. In November and December, the forecast predicts the risk will return to normal for Northern California but will remain above normal for coastal California from Santa Barbara south to the Mexican border. The forecast also makes mention of the fact that the La Niña weather pattern is expected to bring above-normal temperatures and Santa Ana winds to Southern California in November and December. This will heighten the potential for large wildfires, so the insurance industry should likely expect more wildfire loss events over the next couple of months.